49 Criminal Justice Statistics for the United States
The American criminal justice system is vast and ever-changing, with technology and reforms being introduced every day. Let’s look at some key criminal justice data.


The criminal justice field is expansive, covering everything from routine traffic stops and petty theft arrests to detectives investigating violent crimes. Meanwhile, American consumers are becoming increasingly more interested in the field via popular true crime podcasts or crime procedural shows like “CSI.”
But those working in the field know that criminal justice is more than just a trending topic, and that understanding it is key to working in it. Criminal justice data can provide valuable insight into the American public as a whole.
For example, from data about the American criminal justice system, we can learn about how, where, and why Americans commit crimes, how police respond to those crimes, and how criminals are persecuted. On the other side of the coin, statistics in criminal justice can be a valuable tool to learn more about police violence and accountability.
Let’s look at some important American criminal justice statistics to learn more about the way America sees crime. Looking for something different? Check out our post on personal injury statistics to learn more.
Data on the Criminal Justice System
The criminal justice system is the people, institutions, and organizations that create and uphold the law. From criminal justice data like Department of Justice (DoJ) criminal statistics, the conviction rate in America, incarceration numbers, and the number of crimes reported per capita, we can learn a lot about how the American criminal justice system and how it has evolved over time.
- 60% of Americans say their knowledge of the criminal justice system is informed by the media they consume. (1)
- Americans who learn about what lawyers do from the media learn the most from movies and television shows, with 24% reporting that they learn the most on-screen. (1)
- Americans who learn about what lawyers do without the media report learning the most from personal experience, with 24% saying they learn about what lawyers do from a friend or relative in the field. (1)
- 34% of those in the criminal justice field earned a Bachelor’s Degree, and 61% have earned at least an Associate’s Degree. (5)
- Over 1 million people are incarcerated in state jails in the United States. (6)
- 64% of Americans believe that there is more crime in the United States than there was previously, despite reports that the crime rates are falling. (14)
- There were 61,678 cases reported to the U.S. Sentencing Commission in 2024, down more than 2,000 cases from the previous year. (16)
- Immigration and drug-related cases were the most commonly reported to the U.S. Sentencing Commission, both making up just over 18,000 of the reported cases each. (16)
- 88% of people sentenced in the fiscal year 2024 were men. (16)
- 89% of cases in 2024 resulted in a prison sentence, with 52 months being the average length of the incarceration. (16)
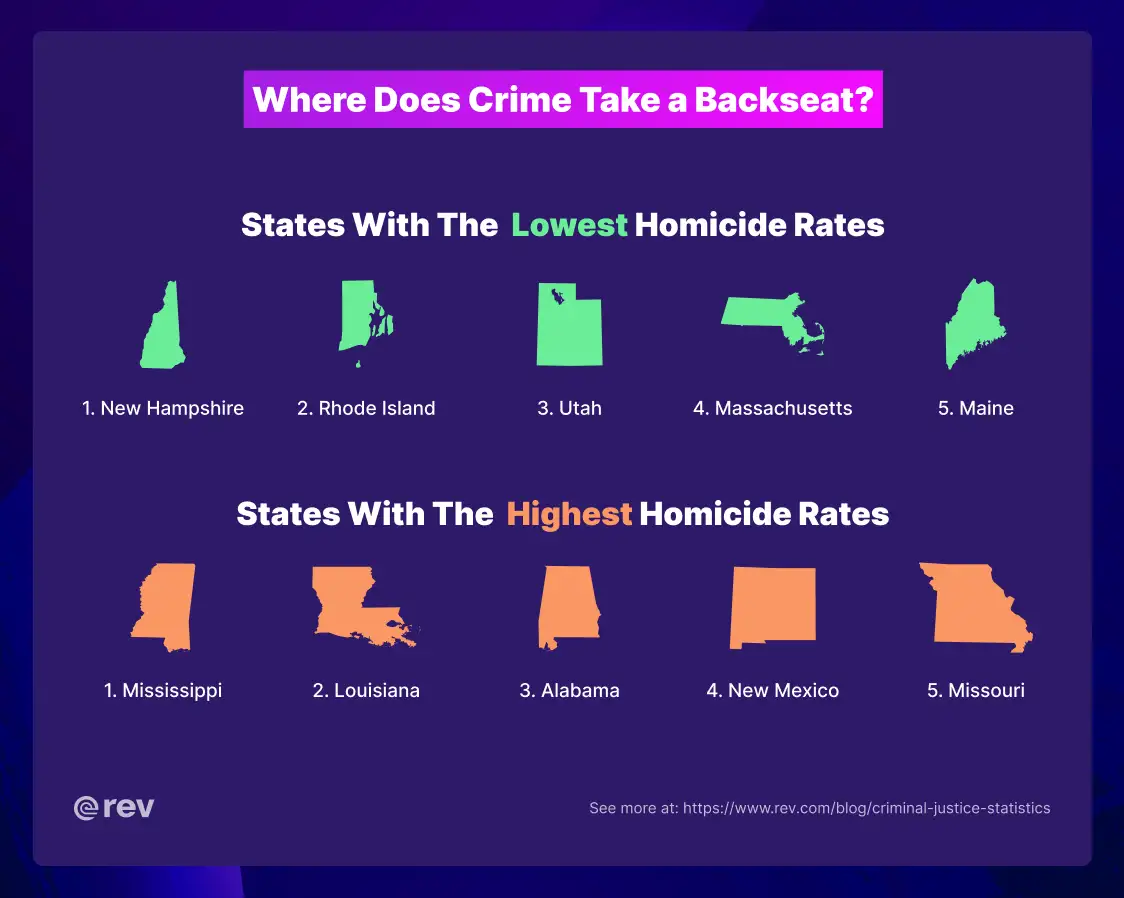
Crime Rates + Data by State
No municipality is created equal. Crime rates broken down by state can give us a bit of a look into what citizens living in a certain geographic area may witness. While crime reports may create fear, they can also be a helpful tool for those living in or traveling to certain areas about what to look out for.
Criminal Lawyer Statistics
A lawyer has a demanding job. Case lawyers have to get to know every inch of their case while preparing for trial, doing client research, uncovering important data or other documents to support their arguments, and preparing their witnesses. Even out of the courtroom, lawyers have to spend countless hours drafting contracts or other important documents.
Criminal lawyers specialize in those facing charges for violent crimes, meaning lawyers do the important work to convict those who have committed crimes or prove the innocence of those who haven’t. Let's take a look at some data regarding criminal lawyers in the United States.
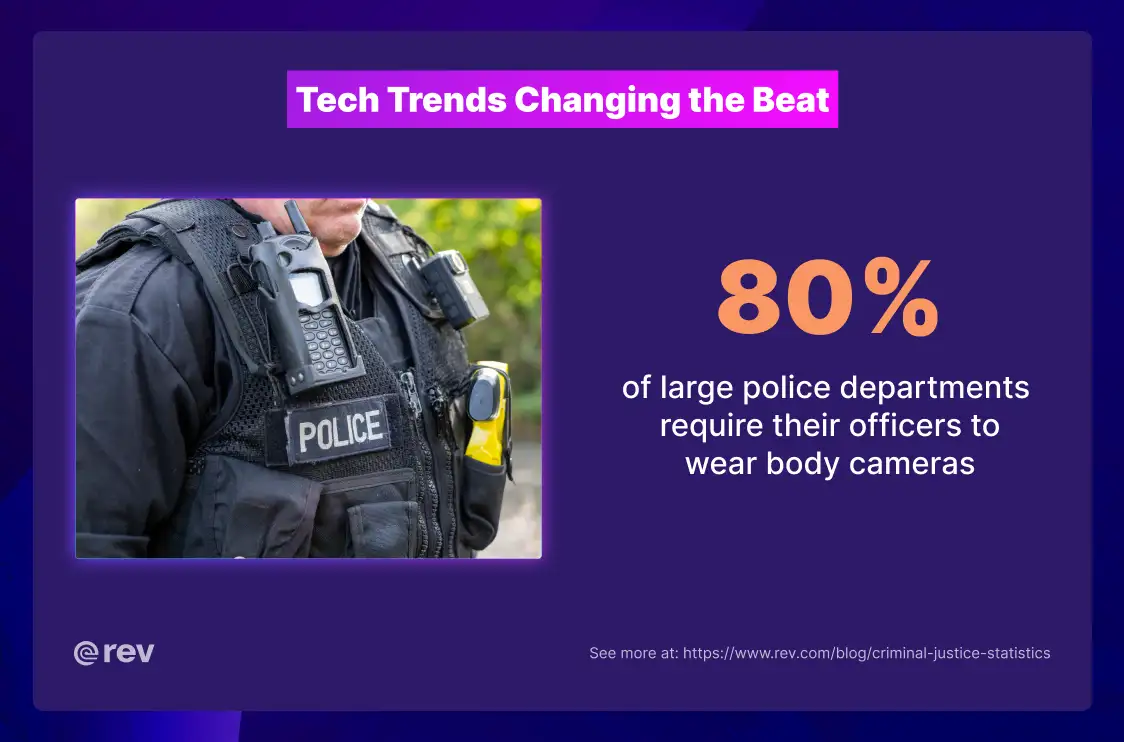
Policing Statistics
Over the past several decades, law enforcement in America has undergone profound changes. As the number of registered police officers has continued to grow, so has the need for better training and accountability processes for those who serve. Here’s a look at the state of policing in America.
Criminal Justice: Growth and Tech
The criminal justice system looks vastly different than it did 10 years ago, and will likely look vastly different 10 years from now. While job opportunities for those looking to enter the criminal justice field climb at a steady pace, so does the technology available to transform the field itself.
However, while AI may be growing as a useful tool for law teams, there is also debate about whether or not it can be helpful and safe to use.
Find the Truth in True Crime
For those working in the criminal justice field, true crime isn’t just a trendy podcast or Netflix documentary: it’s your day-to-day, real life. So you know better than anyone that the work isn’t always exciting enough to be featured on a podcast. Sometimes, it’s sorting through hours of audio or video footage to find that one key piece.
The good news? Rev can step in and help. Our speech-to-text criminal law technology can help transcribe your audio and video footage with ease. Plus, our AI assistant can identify the most important segments for your case and provide actionable summaries.
Resources
- 60% Get Their Legal Knowledge From Media Consumption (Rev)
- 4 in 5 Legal Professionals Are Burned Out: Can AI Be the Lifeline? (Rev)
- FBI Releases 2024 Reported Crimes in the Nation Statistics (FBI)
- Policing by the Numbers (Council on Criminal Justice)
- 65 Criminal Justice Statistics for 2025 (National University)
- Mass Incarceration: The Whole Pie 2025 (Prison Policy Initiative)
- Police and Detectives (Bureau of Labor and Statistics)
- Which states have the highest murder rates? (USAFacts)
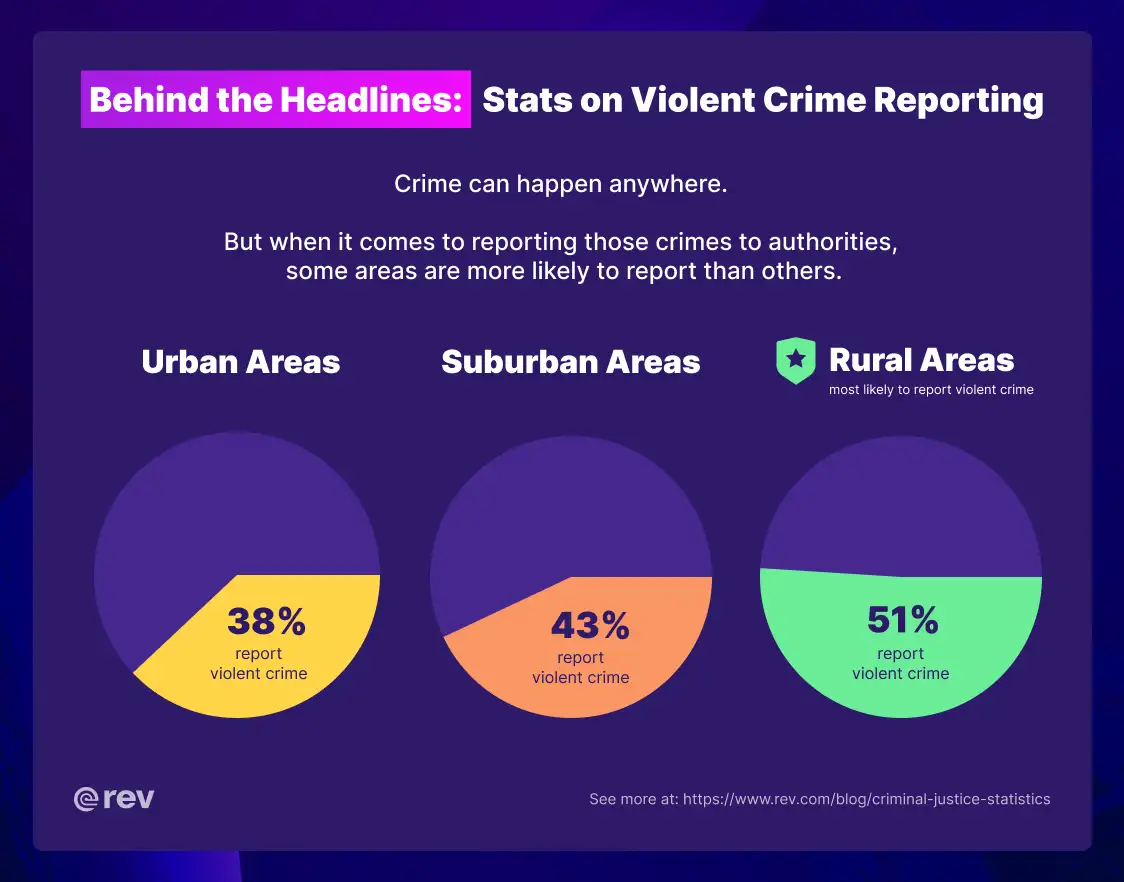
- Reporting to Police by Type of Crime and Location of Residence, 2020–2023 (Bureau of Justice Statistics)
- Despite fewer people experiencing police contact, racial disparities in arrests, police misconduct, and police use of force continue (Prison Policy Initiative)
- Research on Body-Worn Cameras and Law Enforcement (National Institute of Justice)
- Share of Americans who believe there is either more crime than there was a year ago or less in the United States from 1990 to 2024 (Statistia)
- Demographics (American Bar Association)
- What the data says about crime in the U.S. (Pew Research Center)
- Criminal defense lawyer demographics and statistics in the US (Zippia)
- 2024 Annual Report (U.S. Sentencing Commission)
- Crime Trends in U.S. Cities Mid-Year 2025 Update (Council on Criminal Justice)
- Artificial Intelligence and Law Enforcement: The Federal and State Landscape (NCSL)
- AI Is Everywhere in Law — and 68% of Lawyers Trust It With Sensitive Data (Rev)
- Evidence Backlogs Are Driving Delays and Burnout, New AI-Era Survey Finds (Rev)
- Study: Defense Attorneys Find AI Analysis Superior (Rev)